The investment and economic landscapes have undergone a dramatic reshaping in the wake of the COVID-19 pandemic and subsequent severe market volatility. While the net effect has been damaging, it’s provided investors with ample opportunity to re-explore the diversification of their portfolios.
As investors, we are constantly taught the importance of diversification in an investment portfolio. The broad concept of diversification starts at the asset class level – generally stocks versus bonds – to match portfolio risk with your investment time horizon and personal risk appetite. Diversification however also exists within each asset class (i.e. large cap stocks versus small cap, domestic versus international stocks, corporate bonds versus US Treasuries and so on). Emphasizing and actively managing diversification at this sub-asset class level is a way for investors to further manage risk/reward within any given market environment.
Under normal market circumstances, the rules and discipline of diversification are relatively easy to follow: You never know which asset classes will outperform so own a basket of companies of various size, sector and country. You never know when markets will decline or when unexpected life events will occur so own bonds as shock absorbers for the unforeseen.
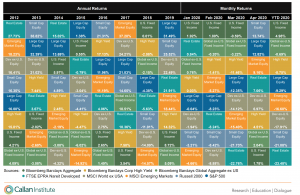
If you have ever worked with an advisor it is likely they have shown you the famous “quilt” chart below, which shows the performance of various types of asset classes on a year-by-year basis:
Bonds (US Agg) have led the way so far in 2020 just as they are expected to do during periods of equity market stress.
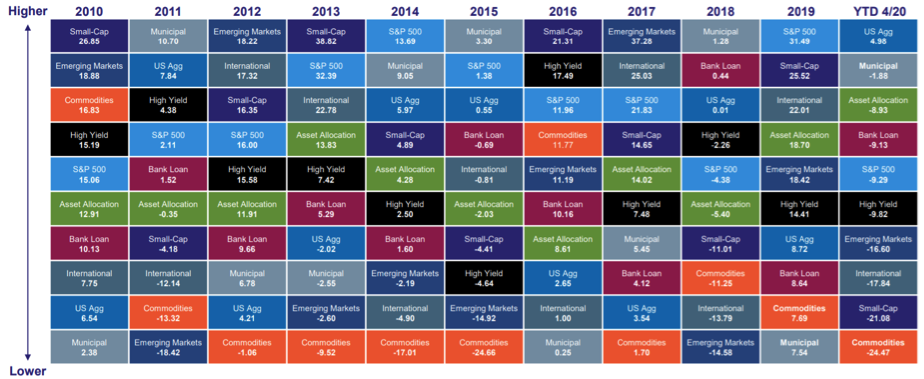
The key message offered by the performance quilt chart is that in the long-term you can win more by losing less during these acute periods of market stress. Further, by smoothing out returns over time you minimize the effects of “loss aversion” that can cause an investor to abandon their long-term strategy. Loss aversion is a central concept in behavioral finance that refers to investor’s psychological tendency to view the pain of losses as much more impactful than the joy of similar sized gains. In other words, losses loom larger than gains on investor psyche.
Q1 2020 is a classic example of the role that bonds play in portfolios. While global equities tumbled (the S&P 500 was down 34% in just over a month) and volatility reached an all-time high, the aggregate US Bond Index (AGG) generated positive returns.
Also of note during the March market free fall, larger stocks with generally less of a debt burden and larger market shares in their respective industry outperformed smaller stocks.
And while equity markets overall have suffered, the performance on a region, sector and style basis have varied dramatically. Let’s review some numbers to help understand the magnitude of these dispersions:
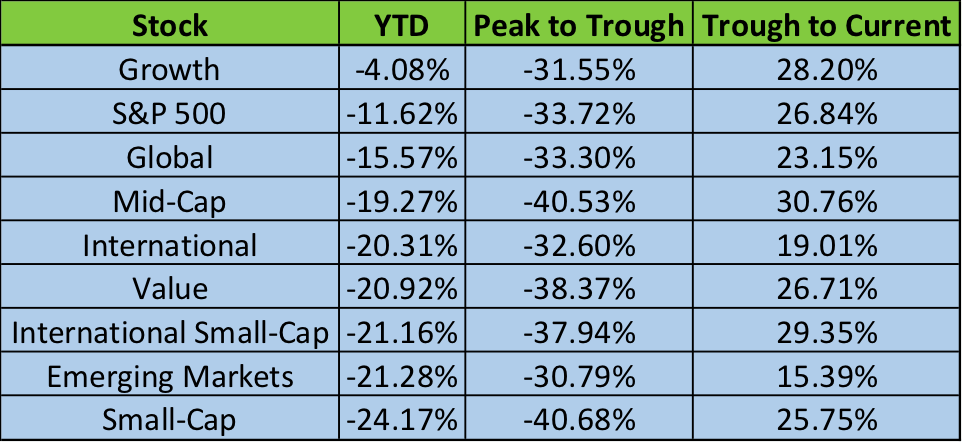
The above chart shows various categories of global equities and how they’ve performed thus far in 2020. The “peak to trough” column incorporates the period from February 19 through March 23 and “trough to current” covers the period from March 23 through May 1.
Broadly speaking, all categories of stocks fell over 30% with some obviously feeling the heat more than others. Since the market’s recent bottom on March 23rd, improved sentiment along with monetary and fiscal stimulus have been the rising tide that lifted most boats after the brutal correction. However, the variance in category performance is worth noticing and speaks to some of the opportunities that exist from a diversification perspective.
Add it all up and you get a few clear and distinguishing observations about the 2020 performance of global equities.
- US stocks continue to outperform international and emerging market stocks– much of this can be attributed to a strengthening dollar, which is up about 4% in 2020. This typically affects EM stocks more than other international stocks. In addition, there was already a grim economic outlook in Europe prior to COVID-19, with their strongest economy, Germany experiencing zero growth in Q4 2019. Finally, outsized stimulus in US as a percentage of GDP (about 11% versus 4% for Europe, for example) has contributed to stronger performance of US stocks.
- Large cap stocks have outperformed mid & small cap stocks – Large Cap companies typically are less leveraged and have more cash on hand versus mid & small cap so they can better weather periods of economic uncertainty.
- Growth stocks have outperformed value stocks – Growth includes many tech and healthcare companies that have gained strategic national importance during the pandemic, whereas value has a higher concentration in financials which are under pressure with a slowing economy and historically low interest rates.
At the sector level there has also been significant dispersion on a year-to-date basis.
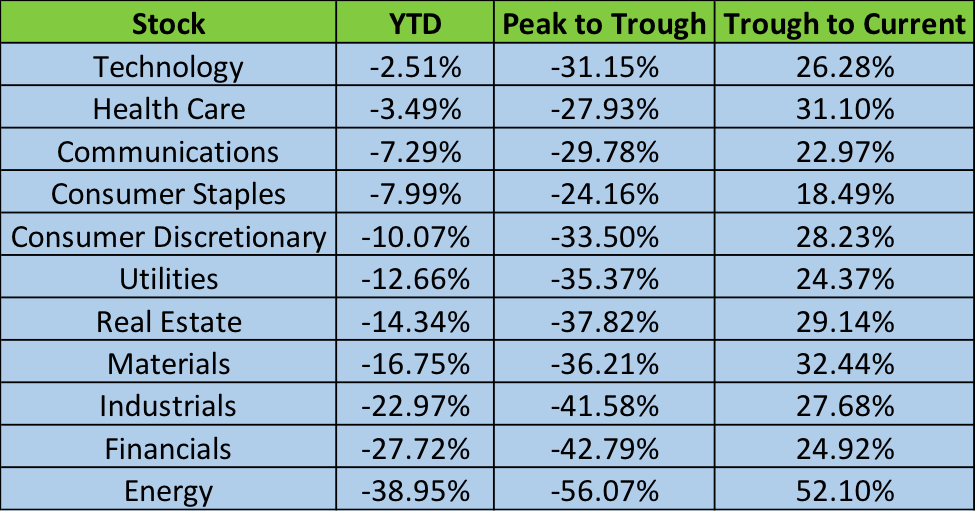
So far in 2020, the difference between the best performing (Tech) and worst performing (Energy) sector is approximately 36.5% in just 4 months. For context, the average dispersion from best to worst performing sector during the last 10 years was approximately 30.5%.
None of the top 4 performing sectors in 2020 are a huge surprise – each of them have their apparent strategic relevance in the “new normal” economy. The pace of technology and digital implementation – while already with us for years – is expected to accelerate in the wake of this pandemic. The price performance of many technology, healthcare and communications companies reflect that sentiment. Consumer staples, led by Walmart and Procter and Gamble – beneficiaries of a huge rush to cleaning supplies, paper goods and other household necessities – were the best performing sector during the decline, but the worst performer on the way up.
On the flip side, structural issues in energy (high debt loads, low energy demand) and financials (low interest rates, unexpected weakening consumer) have become more magnified in this slowdown, upending business models in these industries. Some investors tried to catch a falling knife with energy, contributing further to the sector’s wild ride in the last 90 days. With less economic activity and building, materials and industrials round out the bottom 4 performing sectors – again, not very shocking.
How are we handling all of this? Since late February we dialed in on our diversification framework in an effort to add emphasis on the specific sectors, sub-asset classes and themes that we view as best suited to perform in the current economic landscape and also participate in longer-term trends that will be in place for years to come. We’ve done this by adding exposure to a combination of sector/thematic ETFs (biotechnology, cloud computing, cybersecurity, etc.) and actively managed mutual funds that own concentrated portfolios of high-quality companies primed to gain market share in a post-COVID world.
As the economy undergoes its healing process, investors must be extra diligent about the decisions they make in their portfolios. We think it is best to expect a wide range of outcomes going forward and to still balance portfolios from an asset allocation and risk perspective. However, the longer-term themes at play and the current performance dispersion among various industries, sectors, market caps, and countries offers renewed diversification opportunity and the chance to make thoughtful enhancements to an investment portfolio.