Performance Snapshot:
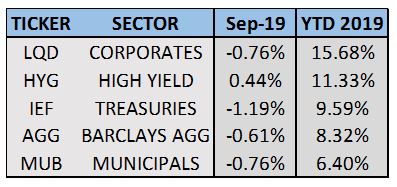
While equities have been strong through September, so too have bonds. In fact, all domestic fixed income sectors have outperformed the S&P 500 since 10/1/2018.
Sector Summary:
US Treasuries: A bounce back in stocks and diminishing headline risk caused a move out of US Treasuries, causing prices to decline and yields to rise across the curve in September. While Treasuries were the best performing fixed income sector in August, they were the worst performing sector in September. The Federal Reserve expectedly lowered its target interest rate at its September 18 meeting, and provided further guidance on anticipated action in the near-term. The spread between the 2 and 10-year Treasury is no longer inverted at the close of September, indicating that global growth concerns remain, but have simmered.
Municipals: Municipal bond yields retreated from historic lows and prices declined in September. This broke an impressive streak by the municipal sector – 10 consecutive months of gains prior to September. Municipal yields rose sharply across the curve, with intermediate maturities experiencing the largest move upward. This caused the municipal yield curve to flatten during the month. Municipal yield ratios versus equivalent Treasuries rose sharply in September, continuing their rise off historically low levels. State and local governments continue to project heavy forthcoming supply with continued low interest rates on municipal debt. Investors still have a health appetite for tax-free income, so the supply and demand dynamics remain relatively in balance.
Corporates: Investment grade corporate bonds declined in September, retreating off all time highs. High yield bonds, on the other hand, gained during the month, as the risk-on environment in September supported this sector. The ebb and flow of trade war and geopolitical concerns have yet to keep either of these sectors down for an extended period in 2019, and corporates remain on pace for their best year since 2009. Corporate bond spreads versus equivalent US Treasuries held firm during September.
———————————————————————————————————————
TREASURY MARKET OVERVIEW
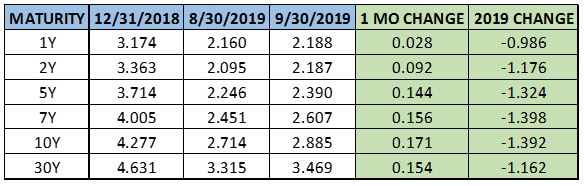
Yield Summary:
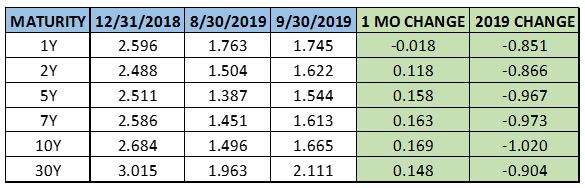
After a strong rally through most of the summer, Treasury prices experienced a pullback in September, as yields rose across the curve alongside a bounce back in global equities. However, there was certainly a tug of war going on as investors tried to balance a variety of positive and negative headlines. The 10-year Treasury yield opened the month by declining to its lowest 2019 close of 1.46% on September 3. From there, upbeat employment data and renewed hopes of a trade deal saw yields spike to 1.9% on September 13. Going into the end of the month, the Fed rate cut and soft GDP data brought yields off that intra-month high, and closed September at 1.66%. This is still over 1% below where the benchmark yield finished 2018.
The Treasury yield curve reversed trend and steepened slightly during September. After closing August slightly inverted, 2-10 Treasury yield spread finished September at 0.04%. Imminent recession concerns seem to have simmered, but that sentiment could change quickly depending on the results of China-US trade negotiations scheduled for early October. Signs of slowing in manufacturing already emerged and the recent GDP report indicated weakness in business investment as companies are playing it conservative and preparing for a potentially wide range of outcomes.
The Federal Reserve met on September 18 and as expected, cut its benchmark interest rate for the second straight meeting. The Fed acknowledged weakness in the global economy and would not necessarily categorize the current rate path policy as a “mid-cycle adjustment,” as it had done previously. Chairman Powell further indicated that policy bias is no longer part of the Fed’s communications strategy. However, as the global economy evolves and if it potentially turns down, the committee would consider a more extensive path of rate cuts.
The Federal Reserve has two more meetings in 2019, one in October and the other in December. The interest rate futures market is currently pricing in a 63% of a rate cut at the Fed’s October 30 meeting. Further, the market assigns an 84.5% chance of at least one more rate cut by the end of 2019, and a 37% chance of two rate cuts. The committee will undoubtedly be further under the microscope over the last 3 months of 2019 as trade negotiations evolve and economic data continues to roll in.
———————————————————————————————————————
MUNICIPAL MARKET OVERVIEW:
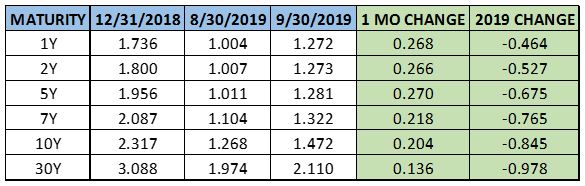
TAX-EXEMPT YIELD SUMMARY:
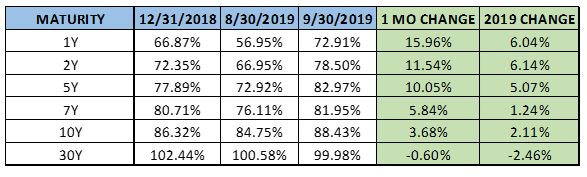
TAX-EXEMPT YIELDS AS A PERCENTAGE OF TREASURIES:
Municipals declined for the first month since October 2018, ending a streak of 10 straight months of gains. The sector eased after reaching historically expensive levels in August. The 10-year AAA municipal benchmark yield rose off its all-time low in August of 1.26% to 1.6% on September 17, before eventually closing the month at 1.47%.
Investors seeking tax-free income continue to offer a floor for the municipal market. For the 38th consecutive week, investors added money to tax-exempt mutual funds according to Lipper’s US Fund Flows data. The market has yet to post an outflow in 2019.
The supply element weighed on performance in September, as the new issuance of bonds during September was 46% higher than it was during September 2018. In addition, visible supply ended the last week of September at $12.5 billion, above the 2019 average of $10.2 billion. Not surprisingly, the continued tendency of municipalities is to issue more debt, taking advantage of low borrowing costs.
However, the anticipated uptick in supply is expected to be absorbed by municipal investors. So far in 2019, municipal issuance has reached $260 billion, with about $330 billion of debt having matured or been called, according to Bloomberg. About $75 billion more is expected to mature or be called, and if issuance maintains the current pace, this should keep a lid on yields and restore strength to the municipal market going into the end of the year.
In September, municipal bonds became relatively cheaper when looking at yields versus equivalent Treasuries, especially bonds with shorter maturities. Specifically, the 2-year AAA municipal yield increased to 79% of the 2-year Treasury yield, after closing August at 67%. While ratios of longer maturities also moved up these bonds did not experience as drastic of an adjustment. The 10-year municipal AAA yield increased to 88% of the 10-year US Treasury, up about 4% from the August close. The tax-equivalent yield of bonds in the intermediate-long portion of the curve continues to be favorable on a relative basis versus shorter maturities.
In contrast to the Treasury curve, which steepened slightly in September, the municipal yield curve flattened. However, investors can still earn more yield by extending maturities on municipal debt. The 2-10 spread in municipals flattened to close the month at about 0.2%, with the same spread being about 0.04% for Treasuries. In addition, the 2-30 spread in municipals is now about 0.35% larger than Treasuries, down from 0.5% at the end of August. Income seekers in higher tax brackets should continue to favor the municipal market as ratios increase with longer maturities as the most attractive area of the yield curve.
———————————————————————————————————————
CORPORATE MARKET OVERVIEW:
INVESTMENT GRADE YIELD SUMMARY:
CORPORATE BOND SPREADS VERSUS TREASURIES:
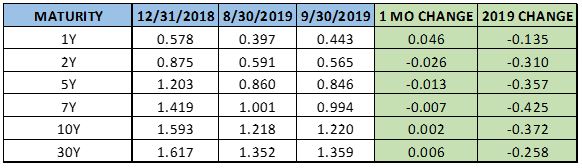
Investment grade bonds followed Treasuries down in August, posting only their second negative month of 2019. However, corporates continue to lead all domestic fixed income sectors and are on pace to return over 20% in 2019, which would be the best year in over a decade. High-yield bonds returned 0.44%, the only fixed income sector that delivered gains in September, as the remaining sectors took a breather. This pushed the high yield index to close the month at another all-time high.
As corporates followed Treasuries down in September, corporate spreads across the curve stabilized, barely changing during the month. Using the 10-year corporate spread versus Treasuries as a benchmark, the difference finished September at 1.22%, still well below 1.59%, where the spread closed 2018. Corporate spreads have tightened strongly across the curve in 2019. This data point remains a contrary signal to other economic indicators that show weakness both in the US and abroad, whereas tightening spreads typically exemplify economic confidence and a healthy appetite for risk.
A big story in the corporate market, like other fixed income markets, continues to be the swelling level of debt. According to Bloomberg, the total value of US investment grade corporate bonds now stands at a record $5.8 trillion. This number has doubled since 2010 and more than tripled since 2008. This is not surprising, given the declining interest rate environment this century. At the same time, earnings are also hitting record levels and can be used to pay down this debt. However, there may still be reason for caution. According to a recent report by Morgan Stanley, the ratio of earnings to a corporation’s interest expense, known as the debt service coverage ratio, has fallen to 10.14 times, the lowest level since 2010. Essentially, earnings are rising but at a slower pace than the cost of servicing the debt issued. This is certainly something we will keep an eye on going forward with the corporate market, in additional to lingering recession concerns.