PERFORMANCE SNAPSHOT
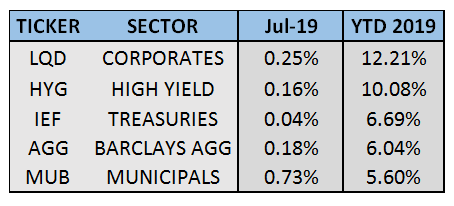
While equities have been strong through July, so too have bonds. In fact, all domestic fixed income sectors outperformed the S&P 500 since 10/1/2018.
Sector Summary:
US Treasuries: The Treasury yield curve flattened, with shorter-term rates rising sharply as the market digested the Fed projections on future rate cuts with continued weak global growth prospects. The benchmark 10-year yield reached a 2019 low of 1.95% on July 3, bounced back up to 2.14% on July 11, before closing the month virtually unchanged at 2%. As expected, at its July 31 meeting, the Federal Reserve cut the Fed Funds rate for the first time in over a decade. Treasuries rallied following the announcement, allowing the sector to eke out a gain for the month.
Municipals: Municipal bonds gained during July, posting the best performance of all domestic fixed income sectors for the month. Yields declined across the curve, with short-term maturities experiencing the largest move down. In addition, Municipal yield ratios versus equivalent Treasuries declined in July, as short-term maturities reached historically expensive levels. Seasonal increases in municipal bond supply have been met with ample demand and the technical outlook for municipals remains favorable.
Corporates: Investment grade corporates scored another month of positive returns, aided by narrowing credit spreads. High yield bonds also generated positive performance but trail investment grade corporates thus far in 2019. Institutional asset managers continue to more closely examine lower investment grade credits and junk debt, as they continue the search for yield in this extremely low interest rate environment but must balance risk and reward with anticipated economic uncertainty.
———————————————————————————————————————TREASURY MARKET OVERVIEW
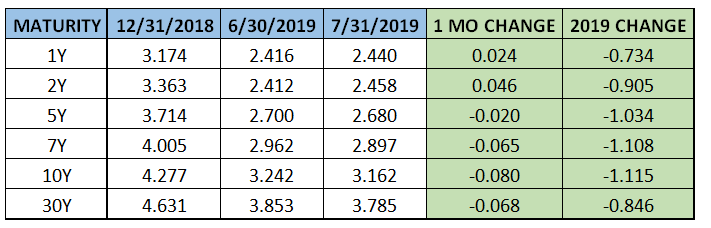
Yield Summary:
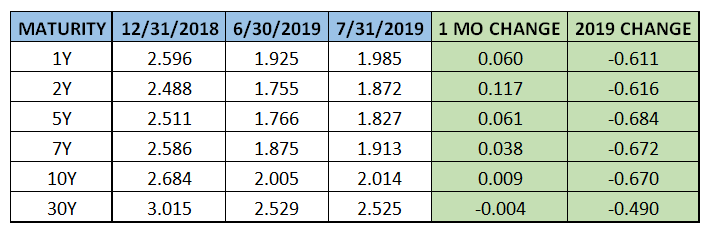
Looking ahead, the market expects the Fed to continue to cut rates, with interest rate futures currently pricing a 100% probability of a cut at the next meeting on September 18, and an 80% chance of at least 2 more cuts by the end of 2019. Fed Chair Powell calls the cut a “midcycle adjustment” and describes it as the latest move in a policy pivot that started with its last hike at the end of 2018. As recently as June, the Fed projected no cuts in 2019 and just one cut in 2020. That stance obviously changed and with the market priced to perfection (equities at all-time highs, unemployment at 50-year lows, mild inflation), the Fed must tread prudently and leave a buffer if economic data and markets begin to really turn south.Trading in the Treasury market was all about the Fed in July, as investors were in wait- and-see mode, seeking hints from the Federal Reserve as to the number of interest rate cuts it projects going forward. When the Fed did act on July 31 and indicated that this rate cut was likely not a one and done Treasuries managed to squeeze out a gain on the last day of the month. Treasury prices rallied with the 10-year Treasury yield declining 0.05% to 2.01%. The committee also decided to halt the reduction of its balance sheet two months ahead of schedule, another indication of its dovish action.
The Treasury yield curve flattened sharply during July, as the market repriced for a 0.25% cut from the Federal Reserve, although some projections were for 0.50%. This caused short-term yields to rise while the long end remained steady. The 2-10 spread narrowed to 0.14% at the end of July, the smallest difference since March. Although the 10-year Treasury sits below the current Federal Funds rate, expected rate cuts over the remainder of 2019 should keep the 2-10 spread in check, avoiding a potential inversion.
———————————————————————————————————————MUNICIPAL MARKET OVERVIEW:
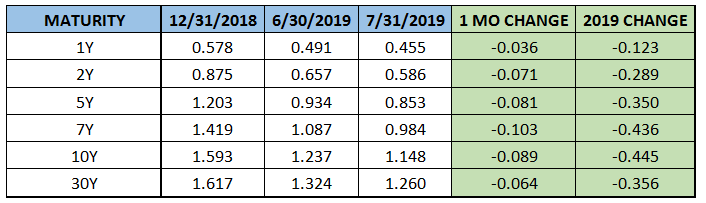
TAX-EXEMPT YIELD SUMMARY:
TAX-EXEMPT YIELDS AS A PERCENTAGE OF TREASURIES:
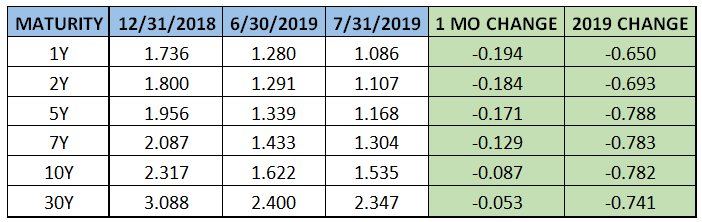
Municipals gained for the 9th consecutive month, continuing their impressive streak of steady returns. Municipal yields declined across most of the curve, with the short-end experiencing a marked, outsized move downward. The 10-year AAA Municipal yield closed the month at 1.54%, reaching the lowest levels since October 2016. The sector led all domestic fixed income sectors in performance for the month, gaining 0.73% as measured by MUB, the benchmark Municipal ETF.
The municipal market continues to be supported by very strong demand, with fund flows reaching historic levels. According to the Investment Company Institute, municipal bond mutual funds continued the trend of positive inflows during July, extending the streak to 29 consecutive weeks, the longest since 2016. In addition, municipal bond ETFs took in $4.2 billion in the first half of 2019, the best start to a year on record. This puts ETFs on pace for the biggest annual inflow of cash since ETFs began covering municipal bonds over a decade ago.
Projections for supply over the next 30 days ended the month at $15 billion after reaching a high in July. The weekly average in 2019 has been $9 billion, as municipalities continue to take advantage of the declining interest rate environment which has shown no signs of slowing down. While experts and economists expect issuance to continue to be strong, to date any increase in issuance has consistently been absorbed because of a robust investor appetite for tax-exempt bonds. As such, the municipal market has yet to show any noticeable signs of weakness in 2019.
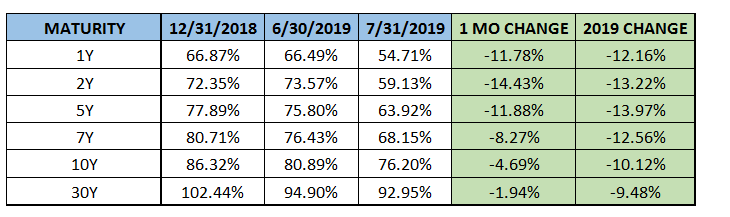
In July, Municipal bonds became relatively more expensive when looking at yields versus equivalent Treasuries, reversing the trend from the previous few months. Specifically, the 10-year Municipal yield declined to 76% of the 10-year Treasury yield, approaching 20-year lows that were reached in May 2019. This ratio averaged 94% over the last 10 years and has been higher than current levels 91% of that same time frame. Despite these dynamics, for income seekers in higher tax brackets, municipals’ tax-equivalent yield continues to be attractive in this area of the curve.
However, the ratios are more extreme on the short end of the Municipal yield curve, where 1-year AAA yields are just 55% of Treasury yields. According to Bloomberg, this is the lowest ratio since the firm started tracking this metric. Nominally, the yield fell to 1.1% in July, the lowest level since November 2017. Similarly, 5-year AAA Municipal yields reached 64% of equivalent Treasuries, the lowest since 2010.
The effects of anticipated Fed actions seemed to have an outsized effect on Municipals, which moved a bit differently than Treasuries during July. While the Treasury curve flattened, Municipals steepened as short-end rates declined more than intermediate portion of the curve. The 2-10 spread in municipals widened sharply to about 0.29% larger than Treasuries, up from 0.08% at the end of June. Furthermore, the 2-30 spread in municipals is now 0.60% larger than Treasuries, up from 0.34% at the end of June. As a result, value in the municipal market remains in the long end of the curve and its exceedingly more challenging to find attractive comparative yields with short maturities.
———————————————————————————————————————CORPORATE MARKET OVERVIEW:
INVESTMENT GRADE YIELD SUMMARY:
CORPORATE BOND SPREADS VERSUS TREASURIES:
Investment corporate bonds continued their strong 2019, achieving positive returns in July and have now returned 12.21% for the year, leading all domestic fixed income sectors. Corporates are approaching their best year since 2019, when they returned 13.5%. High-yield bonds inched towards another all-time high in July and added to their 2019 gain by returning 0.16% in July.
Corporate spreads continued to tighten in July, contributing to the outperformance of investment grade corporates versus Treasuries. Using the 10-year corporate spread versus Treasuries as a benchmark, the difference narrowed to 1.15%, down about 0.45% from the beginning of the year. This is the lowest spread since October 2018, right before equity markets plunged into the end of the year. Tightening spreads typically indicate economic strength, so this signal runs contrary to assessments made by the Fed and economists of a weakening economic outlook.
Despite the talk of slowing economic conditions, the market maintains an appetite for lower rated corporate bonds, even junk debt. Per Bloomberg, large institutional money managers such as Goldman Sachs and T Rowe Price are scouring these credits for opportunity, as global interest rates continue to sink. The highest rated of junk bonds (BB) have performed very strongly as investors have dipped their toes into the ranks of junk debt in this search for yield. This is a shift from earlier this year, when investors were reluctant to buy debt from companies that could be hit hard by an economic downturn. Their growing willingness to add risk signals that money managers may not be expecting a serious recession in the near term, even if slowing growth and weakening manufacturing demand make headlines.