US Treasuries – Despite a dovish tone from the Federal Reserve, Treasuries declined during February as yields rose across the curve. The market does not expect the Federal Reserve to raise their target interest rate in 2019. The Treasury yield curve steepened slightly during the month.
Municipals – Municipals continued their steady climb upwards, generating another month of positive performance. An uptick in supply issuance is expected to be matched by similar demand appetite in municipals. Municipal yields declined at all maturity levels, with more downward movement in the shorter end of the curve.
Corporates – Despite the continue surge in equities during February, investment grade corporate bonds declined slightly for the month. High yield bonds continued their strong start to the year, leading the pack among domestic fixed income sectors. Corporate spreads to equivalent Treasuries tightened in February, continuing the trend from the previous month.
——————————————————————————————————————————- BOND MARKET PERFORMANCE SNAPSHOT:
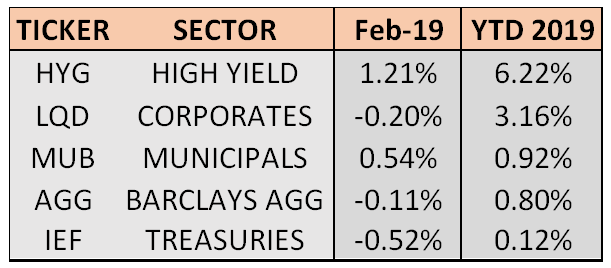
Bonds were mixed throughout February, with high yield and municipals experiencing positive performance as corporates and treasuries lagged and finished negative. The investment grade bond market, as measured by AGG, also declined during the month. Municipal bonds stretched their win streak to 4 months after gaining 0.54% in February, currently the longest positive streak for any sector. US high yield bonds crossed the 6% mark for the year, the best 2-month performance for the sector since 2001. All sectors remain positive for the year, however there is a large divergence among the various sectors.
TREASURY MARKET OVERVIEW:
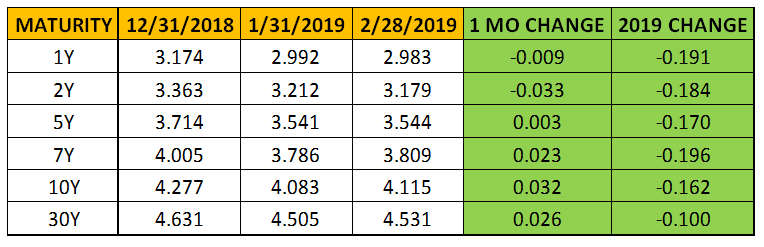
TREASURY YIELD SUMMARY:
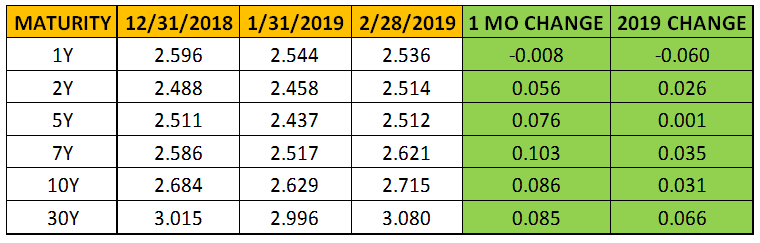
The lack of a sustained trend in Treasury yields can be attributed to continued strength in equity markets and a solid January employment report coinciding with dovish guidance from the Federal Reserve. These forces pulled yields in opposite directions throughout February and have driven the markets thus far in 2019 as geopolitical concerns temporarily subsided.Treasuries snapped a 3-month winning streak in February as yields climbed across the curve, resulting in negative performance for the sector. The 10-year Treasury yield traded in a very tight range during the month, closing each day between 2.63% and 2.72%, before ultimately settling at 2.715% on February 28th.
Specifically, the Federal Reserve released the minutes from their January meeting at the end of February. The minutes showed that forward guidance for Fed policy shifted from further rate hikes to neutral, although their economic assessment showed strength in the labor market and durable growth in GDP. The market took this as a sign of further evidence that the Fed’s tightening cycle has ended. In addition, another important takeaway from the minutes was the conversation about the Fed’s balance sheet. Members of the committee strongly agree that at some point in 2019, the Federal Reserve is likely to halt the reduction of their balance sheet.
Still, no specific target has been named in terms of the size of the balance sheet, but it certainly is something we will keep a close eye on as it relates to monetary policy. The current market expectation is for the Fed to pause in 2019 and not raise the Fed Funds rate at all, the same sentiment as last month.
The Treasury yield curve steepened during February, with the 2-10 spread creeping up to 0.20%, where it started this year. The 5-year Treasury inched up enough to be just about even with the 2-year yield and still slightly below the 1-year yield. The end of the government shutdown reduced near-term uncertainty as the 1-year yield remained static during the month while longer maturities experienced an increase in yield.
——————————————————————————————————————————- MUNICIPAL MARKET OVERVIEW:
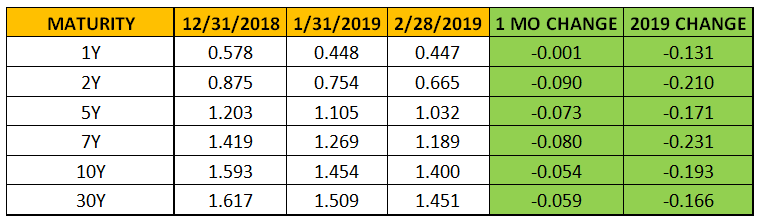
TAX-EXEMPT MUNICIPAL YIELD SUMMARY:
TAX-EXEMPT MUNICIPAL YIELDS AS A PERCENTAGE OF TREASURY:
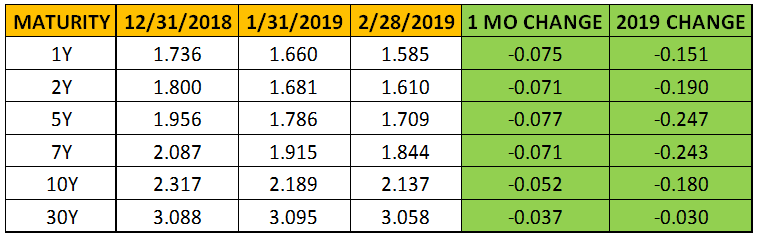
Municipal issuance spiked over the first two months of 2019 and there appears to be enough demand to match this new supply. Almost $25 billion of municipal bonds were issued in February, a 51% increase from February 2018. The year-to-date total now sits at $49 billion, which represents a 33% increase from this same time last year, according to Bloomberg. Some economists attribute the difference between this year and last as a residual effect of the tax law change which caused a flood of sales late in 2017. More importantly, however, is that municipal demand seems to be matching up with this increase in supply. According to the Investment Company Institute, investors have added $16 billion to municipal bond mutual funds in 2019, with 8 straight weeks of inflows to start the year.Municipals continued their streak of positive, steady performance in February. Municipal yields declined across the board, with shorter maturities declining more than longer-dated maturities. The 10-year AAA muni benchmark yield closed February 26 at 2.118%, the lowest yield in over 13 months. That close also marked a sizable 0.7% basis point decline from its 2018 peak on November 6. It’s easy to see why municipals have performed so well over the last 4 months!
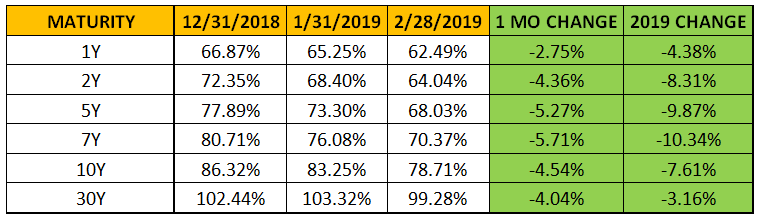
Relative valuations continue to be lofty as municipals grow increasingly expensive versus equivalent Treasuries at all maturities. Specifically, maturities in the 1-5-year range continue to be the most expensive, trading below 70% of Treasuries. In addition, the 10-year AAA muni reached its most expensive level versus Treasuries since 2009, breaking below the 80% mark. Similar to Treasuries, the municipal curve steepened during the month. However, in the case of municipals, the steepening was caused by longer maturities moving down less than the shorter maturities. The 2-10 spread in municipals remains about 32 basis points larger in the municipal market versus the Treasury market, and the 2-30 spread grew to 88 basis points larger at the end of February. The value in the municipal market continues to be found on the longer end of the curve.
Municipal investors have a decision about whether to extend duration as the short-end of the curve continues to reach valuation levels not seen in over a decade. Demand in the municipal market remains strong overall and should continue to reward investors for moving out further on the curve.
——————————————————————————————————————————- CORPORATE MARKET OVERVIEW:
INVESTMENT GRADE CORPORATE YIELD SUMMARY:
 CORPORATE BOND SPREADS VERSUS TREASURIES:
Even though global equities continued their climb up in February, investment grade corporate bonds could not continue their momentum from the previous two months and ended February slightly negative. Corporate spreads versus equivalent Treasuries declined during February, highlighting the relative outperformance of corporates during the month. High-yield bonds turned in another strong month, and have returned 6% thus far in 2019, the leading domestic fixed income sector. In fact, the US High-Yield index hit a record high on February 6. Oil has been a key support for high-yield debt, as crude prices have climbed since December and now sit around $56 per barrel.
Several large US companies have taken steps to reduce their debt loads. In this regard, General Electric made positive headlines for a change, selling its biopharmaceutical business to Danaher for $21 billion and using the money to pay down debt. Kraft Heinz recently announced it was slashing its dividend and using the proceeds of asset sales to reduce its liabilities. Finally, AT&T
is reportedly making the company’s top priority in 2019 to lower its debt, according to Bloomberg. We will have to see if this trend continues as corporate debt swelled to record levels at the end of last year.
Reduced geopolitical tensions and robust economic data have supported both equity markets and corporate bonds during the first two months of the year. In addition, limited headline risk has calmed the fear of contagion within the corporate and high-yield markets. This is a change from the recent narrative around the corporate bond market. In 2018, BBB-rated corporate bonds surged to represent close to 50% of the Bloomberg Barclays US Corporate Bond index, compared with 33% after the financial crisis.
However, Fitch, one of the largest rating agencies, found that more than 90% of companies it rates one or two notches above junk have a “financial flexibility” score that’s greater than or equal to their overall rating. According to Bloomberg, many companies chose to remain in the BBB range to seek the optimal capital structure at a time of historically low borrowing rates. Essentially, what might be rated BBB may have additional financial solvency than the rating indicates. With this in mind, we might expect to see spreads on BBB versus A rated securities tightening significantly. So far this year, this spread has only tightened 7 basis points, so there isn’t much inertia with this mindset just yet.
Recently, credit markets focused on the willingness and ability of the issuers to preserve or improve their credit rating by consolidating/reducing their debt. Bond investors didn’t see that urgency last year, and several headline risks caused spreads to widen and losses in the corporate space. We will have to see if this shift continues as it has in the first two months of 2019 and if it leads to continued positive performance.