Performance Snapshot:
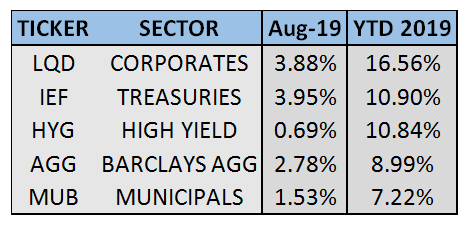
While equities have been strong through August, so too have bonds. In fact, all domestic fixed income sectors have outperformed the S&P 500 since 10/1/2018.
Sector Summary:
US Treasuries: Mounting equity market volatility in August directed investors to the safety of Treasuries, with prices increasing and yields declining across the board. As a result, Treasuries were the best performing sector in August, earning close to 4% as measured by IEF, the 7-10-year Treasury ETF. Continued worries over a trade war, coupled with intensifying concerns over global growth caused the spread between the 2 and 10- year Treasury to invert for the first time in over a decade. The Federal Reserve meets again on September 18, with market expectations of another cut to the Fed Funds rate.
Municipals: Municipal bonds continued their steady performance in August, as the flight to quality also supported this market. Municipal yields declined across the curve, with longer-term maturities experiencing a larger move down, continuing to play catch up with shorter-term maturities that plunged earlier this summer. State and local governments are selling bonds at the fastest pace in over 2 years, continuing to take advantage of declining borrowing costs. Consequently, municipal yield ratios versus equivalent Treasuries rose sharply in August, retreating off historically expensive levels. While investors still have an appetite for tax-free income, this was a welcome development for municipal investors looking for relative value.
Corporates: Investment grade corporates continued their impressive run in 2019, increasing sharply in August. In addition, high yield bonds also gained. Despite the growing uncertainty in equity markets throughout the month, these asset classes delivered positive returns. Economic growth concerns have not deterred investors from this market, which is on pace for its best year since 2009. Corporate bond spreads versus equivalent US Treasuries declined during August, as the global search for yield continues to permeate all fixed income markets.
———————————————————————————————————————TREASURY MARKET OVERVIEW
Yield Summary:
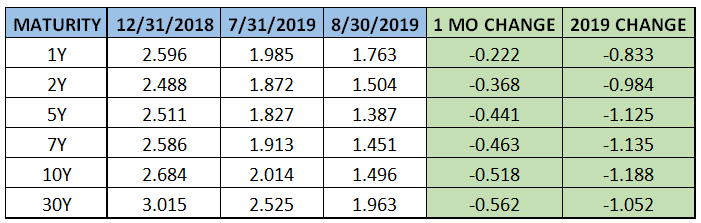
Investors piled into the Treasury market in August, driving yields down to within earshot of all-time lows. The 10-year Treasury dropped over 0.5% for the month, closing at 1.5%, the lowest level since July 2016. This monthly drop in 10-year Treasury yields is the largest since January 2015, when the benchmark yield declined 0.53%. Yields across the curve have declined significantly in 2019, with intermediate and longer maturities now over 1% below where they finished last year.
The Treasury yield curve flattened significantly during August. The 2-10 spread closed the closed the day inverted on August 26 for the first time since 2007, and reached – 0.05% the following day, before ultimately closing the month slightly inverted. This signal caused many economists and investors to call for recession, which is typically preceded by a yield curve inversion.
The Federal Reserve did not meet in August, but the interest rate futures market is currently pricing in a 100% probability of a cut at the next meeting on September 18 and a 90% chance of two cuts by the end of 2019. With that in mind, investors expect the yield curve to steepen as the Fed continues to cut. However, according to Bloomberg, the renewed threat of large-scale asset purchases (QE) is likely to keep the long end of the yield curve suppressed. In addition, while the 10-year Treasury-yield of 1.5% is close to historic lows, it’s still well-above yields of other developed economies around the globe. For example, German 10-year yields closed the month at -0.6% and Swiss 10-year yields closed the month at -0.95%. Thus, investors searching for sovereign debt with positive yields have limited options, which should also work in favor of long- term Treasury yields not moving markedly higher unless something changes dramatically in the current environment.
———————————————————————————————————————MUNICIPAL MARKET OVERVIEW:
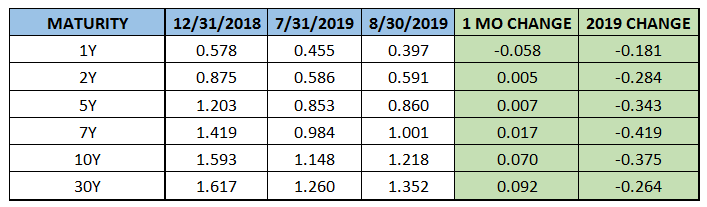
TAX-EXEMPT YIELD SUMMARY:
TAX-EXEMPT YIELDS AS A PERCENTAGE OF TREASURIES:
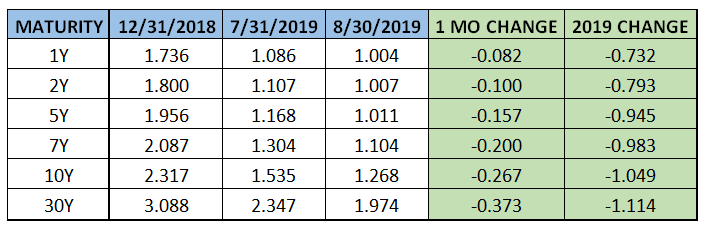
Municipals generated positive returns for the 10th straight month, continuing a historically strong streak of steady gains. The 10-year AAA municipal benchmark yield reached an all-time low on August 15th of 1.246%, eclipsing the previous low reached in June 2016.
Tax-free income and positive yield continue to trade at a premium in the current environment, as the municipal market continues to experience consistently robust demand. Per the Investment Company Institute, municipal bond mutual funds extended the streak of positive inflows to 34 weeks. Thus, every week this year has seen inflows into municipal mutual funds.
The supply side of the equation could slow down the pace of the municipal bond rally. According to Bloomberg, projections for municipal bond supply over the next 30 days ended August at $13.1 billion after reaching a 2019 high in July. The weekly average this year has been $9.8 billion. In addition, municipal bond sales in August totaled $36.9 billion, the most in a month since 2017, and 22% higher than August 2018. Furthermore, according to a report by Citigroup, the volume of new municipal bond sales in September will exceed the amount that investors will receive from maturing debt and interest payments by $1.7 billion. The bank forecasts about $34.5 billion in new sales, versus $32.8 billion in maturing bonds and interest payments during the month. This technical backdrop for municipals could cause weakness going into the end of the third quarter for a sector that has yet to show any in 2019.
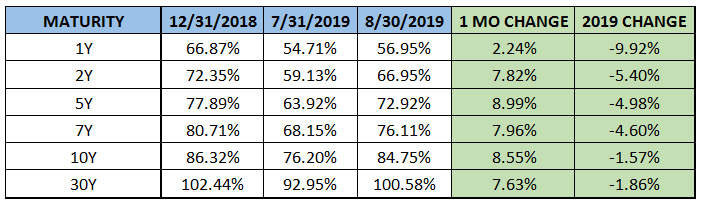
In August, municipal bonds became relatively cheaper when looking at yields versus equivalent Treasuries. Specifically, the 10-year municipal yield increased to 85% of the 10-year Treasury yield, after reaching 72% in May, the lowest level this century.
However, ratios on the short end of the municipal curve continue to sit at more extreme levels, where 1-year AAA yields are just 57% of Treasury yields. The tax-equivalent yield of bonds in this range isn’t favorable, and we therefore expect to see this ratio increase from the current historically expensive level.
The municipal curve flattened in August. However, in contrast to the Treasury curve, municipal investors can earn more yield by going further out in maturity. The 2-10 spread in municipals sits at 0.26%. The same spread is 0% for Treasuries. In addition, the 2-30 spread in municipals is now about 0.5% larger than Treasuries, up from 0.34% at the end of June. Income seekers in higher tax brackets will likely continue to flock to municipals as ratios increase, but longer maturities are currently the most attractive area of the curve.
———————————————————————————————————————CORPORATE MARKET OVERVIEW:
INVESTMENT GRADE YIELD SUMMARY: 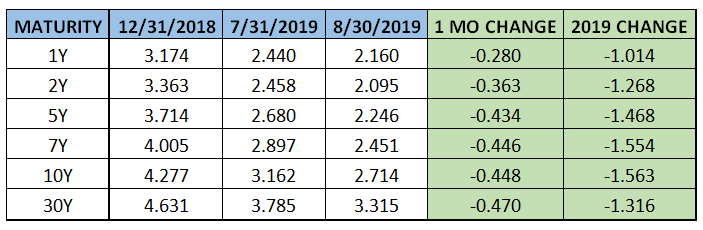
CORPORATE BOND SPREADS VERSUS TREASURIES:
Investment grade corporate bonds continue to deliver in 2019, with a strong August pushing total returns for the year over 16%. Corporates continue to lead all domestic fixed income sectors. Corporates are approaching their best year since 2009, when the sector returned over 18%. High-yield bonds, which typically exhibit a higher correlation to equities, reached another all-time high and returned 0.69% during August in the face of significant equity market volatility.
While corporate returns basically matched Treasuries in August, corporate spreads widened during the month. Using the 10-year corporate spread versus Treasuries as a benchmark, the difference increased 0.07% to 1.22%. This ratio began 2019 at about 1.59%, so it has still noticeably tightened this year. Tightening spreads typically indicate economic strength, so this signal runs contrary to the recently inverted Treasury yield curve, in addition to assessments made by the Fed and economists of a weakening global growth outlook.
Like municipalities, corporations continue to take advantage of the low interest rate environment with record new bond issuance. According to Bloomberg, $74 billion was expected to be issued in the first week of September, which would be the largest weekly issuance on record. Average yield on investment grade issuance is 2.77% according to Barclays. This number was 4.3% in November 2018, so it is easy to see why many corporations are taking advantage of the current, low interest rate environment.