US Treasuries – After a very strong March, Treasury prices declined in April. Yields rose from the lows of 2019, as economic data improved. Federal Reserve policy remains accommodative, and there is no indication that the committee changed its stance on rate hikes for the remainder of the year. The yield curve steepened over the course of the month, temporarily calming recession fears by virtue of a yield curve inversion.
Municipals – Municipals continue to generate gains and have yet to show weakness in 2019. However, expensively priced municipals may reduce demand going forward, although supply remains depressed. Municipals yields rose across the curve, except for 30-year maturities.
These longer maturities experienced a notable move downward, continuing a pattern from previous months.
Corporates – Corporates continued their strong start to 2019, posting another solid gain in April. Much of the gain can be attributed to the tightening of corporate spreads versus Treasuries, which reached their lowest level of 2019. Headline risk has been reduced in the sector, although credit quality deterioration based on where the market is in the credit cycle continues to be watched closely.
——————————————————————————————————————————- BOND MARKET PERFORMANCE SNAPSHOT:
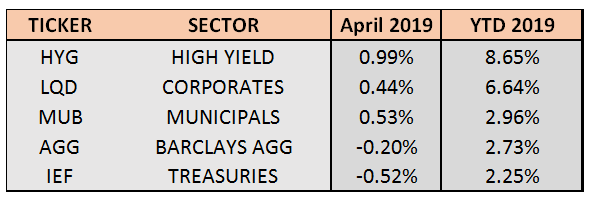
Bond returns were mixed across all sectors in April, with municipals and corporates posting gains. On the other hand, Treasuries and the Barclays Aggregate Bond Index (AGG – composed largely of Treasuries), declined. High yield, the best performer in 2019, showed continued strength and is now up 8.65% over the first 4 months of the year. Municipal bonds leapfrogged the AGG and Treasuries to become the second-best performing sector after extending their win streak to 6 straight months. Treasuries were the biggest loser in April and have lagged thus far year-to-date. However, all fixed income sectors have posted strong returns in 2019.
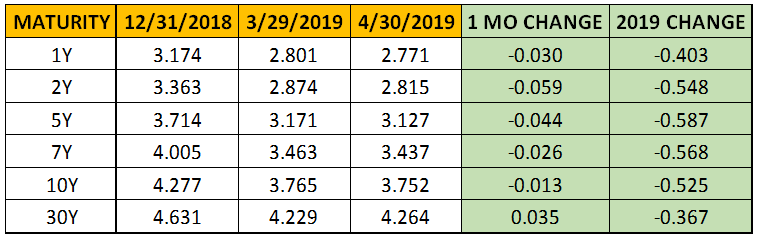
TREASURY MARKET OVERVIEW TREASURY YIELD SUMMARY:
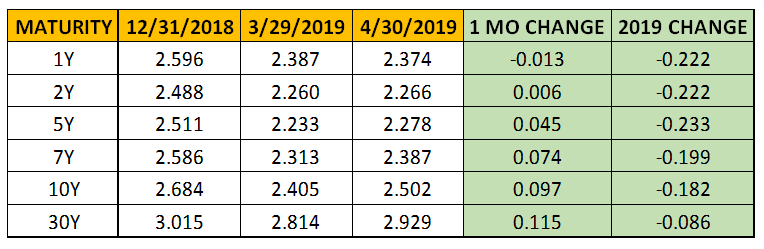
Reduced headline risk and improved economic data led to the rise in yields. Beginning the job market which released employment data on April 5 shows that the US added 196,000 jobs in March, bouncing back from 20,000 jobs that were added in February. Wage growth on an annualized basis showed strength yet still has room for growth and the labor market continues to be a highlight for the US economy. Treasuries delivered negative returns in a choppy month of trading, with the benchmark 10- year yield rising from 2.4% to 2.5%. Nonetheless, despite April’s increase, the 10-year has still dropped 0.20% since the beginning of 2019 and is well below its 200 days moving an average of 2.84%.
Many economists and central bank estimates for global growth were slashed over the previous months, and the Fed decision in March reflected a similar sentiment. However, a bounce in exports and export prices headlined strong March Chinese trade data, raising hopes for a rebound in growth. Coupled with a strong Q1 US GDP release at the end of April, the outlook for future growth inched higher during April and Treasury yields rose as a result.
The Federal Reserve did not meet during April and market projections indicate that the Fed will maintain its target interest rate at 2.25%-2.5% for the remainder of 2019. Despite growing pressure from the President to cut rates, no immediate action is expected at the meeting in May. However, any cracks in the economy or equity markets could reinitiate that conversation.
The Treasury yield curve steepened during April, reversing a trend from the first 3 months of 2019. The 2-10 spread widened from 0.14% to 0.24%, the highest level it has reached since November 2018. The steepening occurred as 1-2-year maturities stayed virtually the same, but longer maturities experienced an increase in yields.
The 1-year Treasury yield remains higher than 2 and 5-year yields, reflecting a persistent near- term uncertainty for the US economy. However, economists and investors who believe the 2-10 spread is a reliable predictor of a recession can breathe a little easier. The growth outlook remains tepid as the 30-year Treasury sits below 3%, but a steepening yield curve eases chatter about a looming recession.
——————————————————————————————————————————- MUNICIPAL MARKET OVERVIEW:
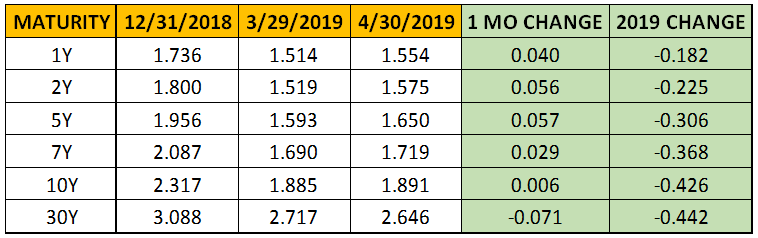
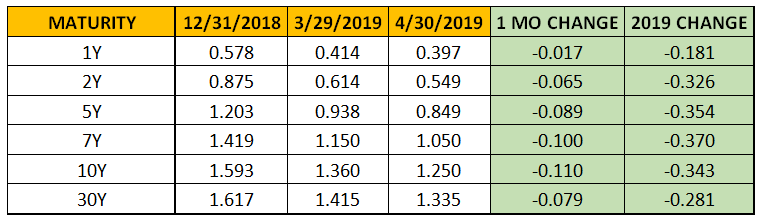
TAX-EXEMPT MUNICIPAL YIELD SUMMARY:
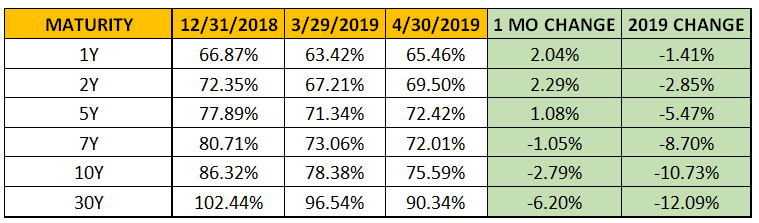
TAX-EXEMPT MUNICIPAL YIELDS AS A PERCENTAGE OF TREASURY:
Municipals are off to their best 4-month start since 2014, bolstered by low supply and continued strong demand as investors look to strategically use tax-exempt debt to offset the federal cap on state and local tax deductions. According to the Investment Company Institute, investors added $4 billion to municipal bond mutual funds during April, increasing the streak of consecutive weeks with inflows to 17. Another month of gains for municipals continues an impressive 6-month win streak, and the sector continues to be expensive. The collective sector gained in April, but municipal yields on maturities 10-years and shorter ticked up slightly. This minor easing brought those shorter maturities back from historically expensive levels versus equivalent Treasuries. The 10-year AAA Muni benchmark yield closed the month almost exactly where it started at 1.89%, hovering near its lowest yield since September 2017.
The supply-side picture should also provide some tailwinds for the municipal market. Per Bloomberg, state and local governments are set to pay off $117 billion of debt from June through August, an average of $39 billion per month. This amount far exceeds the average of
$26 billion per month of new securities that have been issued each month so far in 2019. This paid off debt will have to find a new home and should keep somewhat of a ceiling on municipal yields barring any external shocks.
Municipal bonds remain expensive when looking at yields versus equivalent Treasuries. This notion is confirmed by 10-year Treasury yields rising 10 basis points in April, and 10-year municipal yields staying flat. Looking even farther out on the curve, 30-year Treasury yields rose 11 basis points and 30-year municipal yields were the anomaly for the month, dropping 7 basis points to 2.64%, their lowest level since 2017. This additional step down in yields for longer-term municipals brings the total drop for the year to 44 basis points, versus only 9 basis points for 30-year Treasuries. Consequently, this brings the 30-year municipal yield to 90% of an equivalent Treasury, the lowest level since 2012.
Overall, the municipal curve flattened during the month. Investors caught on to the relative value that could be achieved by extending duration as longer-term yields declined while yields on the rest of the curve rose. The 2-10 spread in municipals is now only 8 basis points larger than Treasuries, down from 34 basis points at the beginning of 2019. In addition, the 2-30 spread in municipals is now 41 basis points larger than Treasuries, down from 65 basis points at the end of March.
Value in the municipal market still exists on the long-end of the curve but spreads have tightened and that value has been diminished over the first 4 months of 2019. We will continue to watch this going forward, especially if Treasury yields continue to tick up.
——————————————————————————————————————————- CORPORATE MARKET OVERVIEW:
INVESTMENT GRADE CORPORATE YIELD SUMMARY:
CORPORATE BOND SPREADS VERSUS TREASURIES:
High yield bonds turned in another positive month and have returned 8.65% so far in 2019, its best 4-month start to the year in over a decade. The global high yield index reached yet another all-time high in April as yields in this sector reached a 12-month low. High yield spreads dropped to their lowest levels since 2017, causing investors in the high yield market to reach even further for yield, adding CCC rated debt, according to a recent report by Bank of America. A mild, quiet equity market provides no headline risk for the corporate bond market. April’s performance pushed total return in 2019 to 6.64%. The biggest contributor to these gains was the tightening of corporate spreads versus Treasuries, which declined over 10 basis points on certain spots on the curve during April. Using the 10-year corporate spread versus Treasury as a benchmark, the difference has shrunk to 1.25%. This spread is down 34 basis points since the beginning of the year, reaching its lowest level since early October 2018 when the equity market selloff started and spreads blew out.
In the last week of April, investment-grade corporate funds saw the pace of inflows fall to their lowest level since January, although the inflow streak reached 14 weeks. This comes after the prior week saw $5.9 billion added to corporate funds, the largest inflow since 2015. The latest inflow data comes as certain companies face resistance offering bonds in the primary market during April. Ford and Philip Morris are a couple of large issuers who experienced challenges in recent bond offerings. Philip Morris paid double-digit concessions – the spread between the
yield of a new bond versus where the issuer’s comparable debt trades – well above the 2019 primary corporate market average of 3 basis points. Ford Motor Company issued bonds at the end of the month and the offering price failed to improve from the initial price, often considered the floor of pricing, due to weak demand. Even though robust investor appetite persists in the overall corporate market, these struggles with initial offerings should be watched as the year goes on.